
Crypto Liquidity in Transition: How Market Depth Evolved in 2025
 7 minutes

Global Liquidity Landscape: A Year of Shifting Depth
Cryptocurrency liquidity underwent dramatic shifts in 2025, marked by periods of abundant depth and sudden droughts. Early in the year, a wave of institutional inflows, bolstered by spot Bitcoin ETF approvals in the US and clearer regulations in major markets, began deepening order books. Bitcoin led this cycle: over $732 billion of new capital flowed in, lifting its market dominance near 60% (up from ~39% in late 2022). One-year realised volatility for BTC nearly halved from ~84% to ~43%, reflecting sturdier market depth and more institutional participation. By Q4 2025, average spot volumes had roughly doubled from prior-cycle levels (rising to ~$8–22 billion/day versus $4–13 billion before), and CME’s share of futures open interest hit 30%, signifying a growing Wall Street footprint. Liquidity improved not just in size but quality: bid–ask spreads on top exchanges narrowed as market makers aggressively arbitraged across venues, and large trades moved prices less than a year prior.
However, 2025 also proved that liquidity can be fleeting under stress. A sharp October sell-off, triggered by overleveraged positions, new Asian regulations and cyberattacks, exposed lingering fragility. Order books on major exchanges thinned out rapidly as panic selling hit, revealing that much of the “liquidity” during calm periods was illusory when sellers overwhelmed buyers. Even blue-chip coins saw spreads widen and intraday volatility spike, with some pairs plunging over 30% in hours. Market makers, unbound by obligations that stock exchanges impose, simply pulled their bids. By mid-November, Bitcoin’s order book depth within 1% of price had collapsed ~33% (from ~$20 million to ~$14 million), and total visible BTC liquidity fell from ~$766 million to $535 million. In short, after a year of rising tides, the late-2025 liquidity squeeze reminded everyone that depth can evaporate suddenly, a structural vulnerability that crypto markets are still working to overcome.
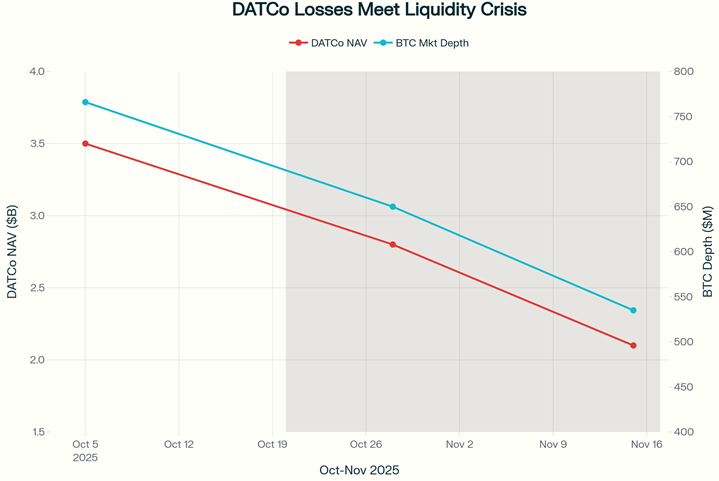
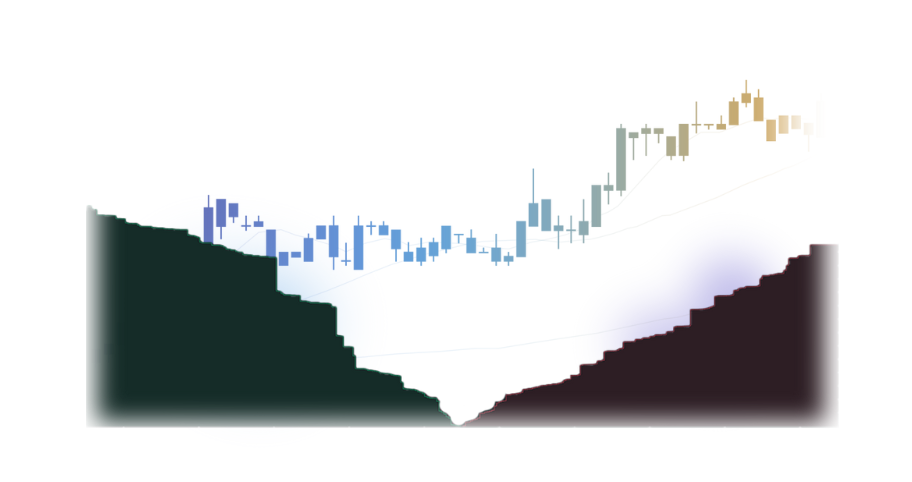
Q4 Liquidity Crunch: By mid-Q4 2025, Bitcoin’s order book depth (blue, right axis) shrank by ~30% while crypto treasury firms (“DATCos”) saw net asset value plunge (red, left axis). The combination of forced selling and withdrawing market makers created a self-reinforcing liquidity crisis via investing.com.
Emerging Markets on the Rise
While global hubs like the US and Europe still dominate absolute volumes, emerging markets drove some of the fastest growth in 2025. Asia-Pacific (APAC) led all regions with a +69% year-over-year increase in on-chain transaction value, reaching $2.36 trillion, thanks to booming activity in India, Vietnam, Pakistan and more. Latin America wasn’t far behind at +63% growth, as countries from Brazil to Mexico saw surging retail and institutional usage. Even Sub-Saharan Africa grew 52% amid heavy reliance on crypto for remittances and payments. These figures underscore a broad shift of crypto momentum toward the Global South, where on-the-ground utility (from inflation hedging to cross-border transfers) is fueling adoption. In Eastern Europe, grassroots uptake was especially notable when adjusted for population; Ukraine, Moldova and Georgia top the list for activity per capita, as economic uncertainty and capital controls there make crypto an appealing alternative.
Crucially, emerging markets are not just using crypto; they’re providing liquidity to it. In Latin America, 2025 trading volumes hit multi-year highs, averaging over $3 billion monthly and totalling $16.2 billion in Jan–May (up 42% vs. the prior year) despite a global slowdown early in the year. Much of this volume is concentrated in USD-pegged stablecoins, which account for nearly half of trading in LATAM and act as the de facto bridge currency amid local fiat instability. Regional exchanges like Brazil’s Mercado Bitcoin and Mexico’s Bitso grew steadily through 2024, but in 2025, many local traders shifted to global venues as liquidity improved. Notably, after crypto’s post-US election rally, Binance’s market share in LATAM rebounded above 50% for the first time since mid-2022. In Africa and Southeast Asia, a similar pattern holds: global platforms (Binance, OKX, Bybit, etc.) and P2P marketplaces continue to supply the deepest liquidity, even as homegrown exchanges and fintech apps work to gain ground. The takeaway is that emerging economies are increasingly a key source of crypto volume, and improving connectivity is allowing that flow to integrate with global order books rather than stay siloed.
Macroeconomic and Regulatory Catalysts
Macro forces and regulatory shifts were key drivers of liquidity evolution in 2025. At the start of the year, cryptocurrencies found themselves in a liquidity squeeze as central banks maintained tight policy. High interest rates raised the opportunity cost of holding speculative assets, draining liquidity from crypto much as they did from equities. Traders kept one eye on the Federal Reserve: hints of future easing or surprises in inflation data often whipsawed crypto order books, reflecting the asset class’s sensitivity to global risk sentiment. By mid-year, with inflation trending down, markets began pricing in eventual Fed rate cuts, a shift that restored risk appetite and helped fuel crypto’s rally through Q3. Bitcoin’s climb to over $120k by early October rode in part on this macro tailwind, before rate jitters and a broad deleveraging event reversed some gains in Q4.
On the regulatory front, 2025 brought an unprecedented mix of clarity and uncertainty. In the United States, a crypto-friendly turn saw Congress pass laws (like the GENIUS Act) establishing clear rules for stablecoins, and the SEC green-lit multiple spot Bitcoin ETFs. This one-two punch of legitimacy sparked a historic surge in market value, the global crypto market cap topped $4 trillion for the first time following the stablecoin legislation. Institutional investors who had been waiting on the sidelines jumped in as liquidity providers and infrastructure builders, emboldened by the formal recognition of crypto in financial regulations. Stablecoin usage exploded as well: Tether (USDT) was processing around $700B+ per month, even peaking above $1 trillion in monthly volume by June. New entrants like EURC (euro stablecoin) and PYUSD also saw rapid growth off a small base, indicating wider adoption of digital cash beyond the dollar.
Meanwhile, in Asia, regulatory attitudes evolved rapidly. Several countries embraced integration: Japan approved its first yen-pegged stablecoin, and even China was reported to be exploring a yuan stablecoin, a notable U-turn from its prior bans. Hong Kong, South Korea and others pursued frameworks to legalise and supervise crypto trading. These moves promise deeper local liquidity long-term, but the transition wasn’t without hiccups. New compliance obligations and policy shifts in Asia contributed to short-term market stress (as seen in October’s sell-off) when sudden rule changes prompted traders to pull capital. Regulatory news proved to be a double-edged sword: announcements of stricter oversight sometimes sparked immediate outflows and widened spreads, yet the overall trend toward proactive integration (especially of stablecoins into banking systems) has laid the foundations for more robust liquidity in the future. In Europe, the MiCA regulations kicked off, providing a unified licensing regime that, while stringent, gave institutional players more confidence to engage in EU crypto markets. By late 2025, North America and Europe saw renewed institutional volumes; over $2.2 to 2.6 trillion flowed on-chain in each region in the past year, suggesting that the mix of clearer rules and new investment vehicles successfully unlocked fresh liquidity pools.
Market Structure Shifts: CEX to DEX and L2
Perhaps the most striking structural change in 2025 was the rise of decentralised trading venues alongside traditional centralised exchanges. Early in the year, DEX liquidity got a jolt from unexpected quarters: a memecoin frenzy on Solana drove DEX spot volumes in January to $413 billion, briefly pushing the DEX/CEX spot volume ratio to 18.7%, one of the highest ever. The momentum didn’t stop there. With improvements in scalability (thanks to Ethereum Layer-2 networks and alternative chains), on-chain trading became faster and cheaper, attracting more activity. A summer launch of Binance’s “Alpha” routing (which cleverly funnelled some trades to PancakeSwap’s pools) caused the DEX/CEX spot ratio to spike to 37.4% in June. Though that one-off surge normalised, DEXs held a larger share thereafter, hovering around 20% of global spot volume in the second half, up from single-digits in prior years. In fact, October 2025 set a record ~$420 billion in DEX spot volume despite a market correction, underscoring a steady user shift toward on-chain trading.
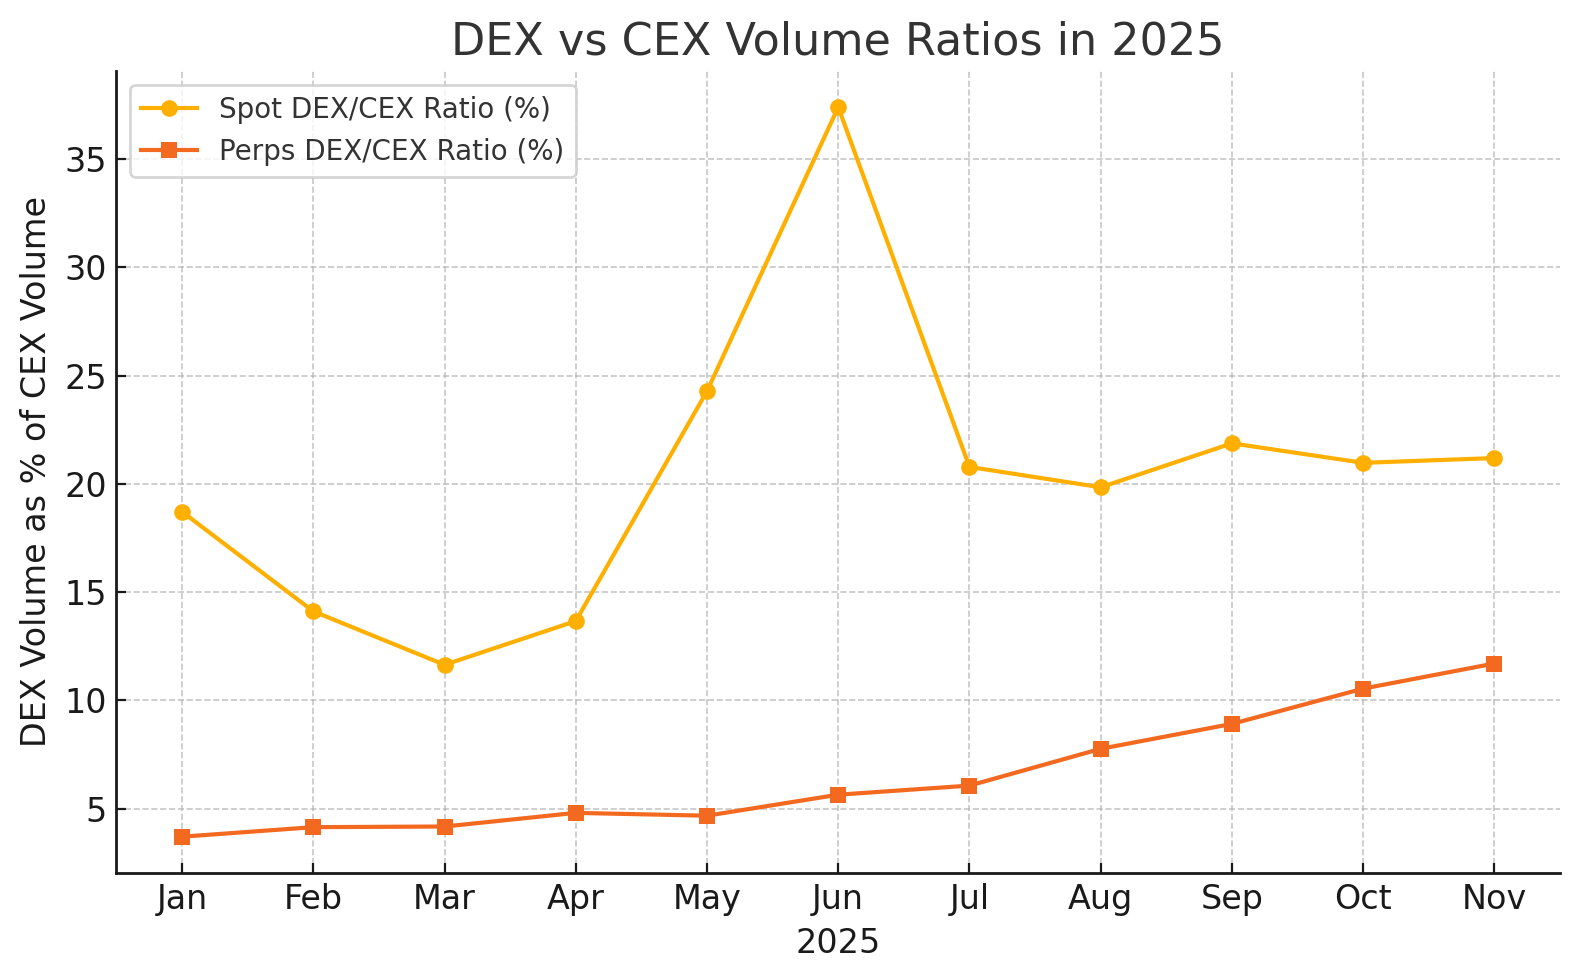
Decentralised vs. Centralised Volume: DEXs made lasting gains in market share. DEX spot trading (yellow) briefly hit ~37% of CEX volumes in mid-2025 before settling ~20%, while DEX perpetuals (orange) climbed steadily from ~4% to ~12% of CEX futures volume by Q4 via Coingecko.
Centralised exchanges, for their part, focused on quality over quantity to retain institutional users. Kraken, Coinbase, Bitstamp, Gemini and others saw increased institutional flows in 2025, benefiting from their reputational strengths. Binance and other high-volume Asian exchanges (like OKX and Bybit) still dominated retail activity and altcoin liquidity, but they grappled with regulatory crackdowns and correspondent banking issues that at times hampered fiat on-ramps. In response, many CEXs expanded support for stablecoin-based trading and offshore banking rails, effectively routing around traditional bottlenecks to keep liquidity flowing. Overall, 2025’s market structure can be described as Bitcoin-led and institutionally anchored on one side, and innovative and increasingly on-chain on the other, a dual paradigm that made the crypto ecosystem more resilient, yet also more complex.
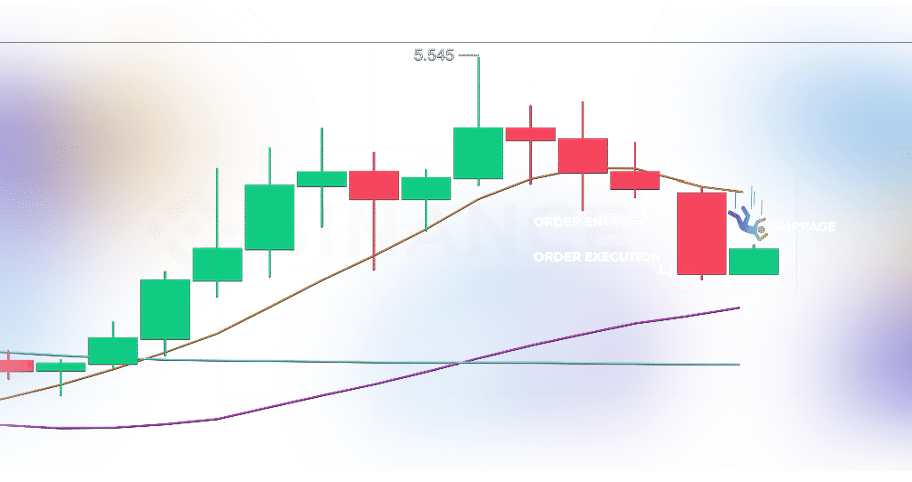
Liquidity Metrics: Spreads, Depth and Slippage
By the numbers, liquidity improved in many areas from January to December 2025, but with important caveats. Bid–ask spreads on major BTC and ETH pairs at top exchanges tightened to some of their narrowest levels ever during high-liquidity periods (often just 1–2 bps on BTC). Depth-wise, prior to the Q4 turmoil, one could execute a multi-million dollar order on a top exchange with less than 0.1% price impact, a marked improvement from 2022 to 2023. According to CoinDesk Research, however, the late-year failure of BTC and ETH liquidity to fully recover post-crash represents a “structural shift,” not just a momentary blip. In other words, market makers became more cautious, and some liquidity quietly disappeared even as prices bounced off the lows. Metrics like order book imbalance and slippage tolerance became closely watched: traders noted that slippage for large orders (e.g. $5M+ USD) was still significantly higher on DEXs than on the most liquid CEXs, though the gap shrank as on-chain pools grew.
Volume distribution also changed alongside liquidity. At the start of 2025, trading activity was fragmented across thousands of long-tail tokens and smaller exchanges. By Q4, volume had reconcentrated toward the top assets and venues. Bitcoin’s dominance rose above 58% of total crypto market cap, and its share of trading volume likewise increased as altcoins retreated (many mid-cap tokens saw liquidity dry up, leading to higher slippage and volatility for those who stayed invested). This “flight to quality” meant that market depth became top-heavy, excellent for BTC and ETH, adequate for a dozen leading alts, but still very shallow beyond that. The October episode illustrated that vividly: while BTC’s 1% depth fell by a third, many smaller tokens saw their available liquidity evaporate almost entirely, leading to 70%+ price crashes in weeks. In DeFi, protocols reliant on automated liquidity found their pools heavily imbalanced during the chaos, causing wider spreads and temporary trading halts for certain pairs as algorithms hit their limits.
On a more positive note, stablecoin liquidity remained robust throughout 2025, acting as the grease in the wheels. The combined supply of the top five stablecoins hit a record ~$263 billion, and on-chain transfer volumes for USDT and USDC averaged an enormous $225 billion per day. This ensured tight FX-like spreads for major stablecoin pairs (often <0.01%), which in turn helped stabilise crypto-to-fiat exchange rates in volatile moments. Spread compression was also observed on regulated venues: for instance, the newly launched US spot Bitcoin ETFs and ETPs in Europe often traded at tight spreads (sometimes <$0.10 wide) thanks to authorised participants arbitraging any premium/discount with underlying markets. Such cross-market arbitrage fed liquidity from traditional financial platforms back into the crypto ecosystem.
Conclusion: A New Liquidity Regime
In the span of one year, the crypto market liquidity transitioned from shallow and fragmented to deeper yet more polarised. Institutional capital brought breadth and stability to the top-tier markets, evident in tighter spreads, thicker order books, and reduced baseline volatility. Emerging market participation injected new volumes and use cases, making crypto markets more globally distributed than ever. And technological shifts (L2 scaling, DEX innovations) began to rewire how liquidity is provided and accessed, chipping away at centralised dominance. Yet, 2025 also exposed the work still to be done: liquidity remains highly pro-cyclical and concentrated. When fear took hold, the lack of obligated market makers or circuit breakers meant that liquidity vanished fastest where it was needed most, exacerbating price swings.
For institutional and exchange-focused readers, the lessons are clear. Market depth is growing, but so is the need for robust risk management. In the coming cycles, we can expect exchanges (both CEX and DEX) to invest further in liquidity programs, smarter routing and perhaps hybrid models that blend on-chain and off-chain order books. Regulators, having seen both the benefits of liquidity (orderly markets) and the risks of its sudden absence, are likely to impose new standards for liquidity providers in high-volume venues. And participants should remain vigilant: the spreads and depth of Q4 2025 tell a story of a market much stronger than a year ago, but not yet immune to shocks. As we head into 2026, crypto’s liquidity is in transition, broader, deeper and more resilient, albeit with a few thin spots that will keep everyone on their toes. The evolution continues, and those who navigate it with data-driven insight will be best positioned to thrive in the next chapter of digital asset markets.
Further Readings:
- CoinGecko Q1 -Q4 2025 Crypto Industry Reports (DEX/CEX ratios, volumes):
https://www.coingecko.com/research/publications/dex-to-cex-ratio - Chainalysis: Geography of Cryptocurrency Adoption 2025
https://www.chainalysis.com/blog/2025-global-crypto-adoption-index - Chainalysis: LATAM Crypto Usage
https://www.chainalysis.com/blog/latin-america-crypto-adoption-2025/ - US Congress: Digital Asset & Stablecoin Regulatory Package (GENIUS Act)
https://www.congress.gov/bill/118th-congress/house-bill/4766/text - EU MiCA Implementation Details (Full Regulation Text)
https://eur-lex.europa.eu/eli/reg/2023/1114/oj - Investing.com: Bitcoin Encounters a Hidden Wave of Selling From Overleveraged Treasury Firms
https://www.investing.com/analysis/bitcoin-encounters-a-hidden-wave-of-selling-from-overleveraged-treasury-firms-200670325 - Kaiko: The State of LatAm Markets 2025
https://research.kaiko.com/reports/the-state-of-latam-crypto-markets-2025


Contact Us
We are always open to discussing new ideas. Do reach out if you are an exchange or a project looking for liquidity; an algorithmic trader or a software developer looking to improve the markets with us or just have a great idea you can’t wait to share with us!