
Crypto Trading 101: Learn the Basics of Trading Crypto
 9 minutes

This article is part of a series of articles where we explain key concepts, such as what is liquidity in the cryptocurrency market, what is slippage, how to read the trading console, what is crypto market making, crypto market making strategies, and more! If you’re a more experienced crypto trader, stay tuned for our upcoming more advanced features on crypto!
We hope you’ll find this article helpful in guiding you through crypto trading 101 basics. We’ll be covering the below topics:
- Crypto Trading 101: Exchanges, Trading Dashboards, Market KPIs, Order Book and History
- Trading Console
- Market Order
- Limit Order
- Stop-limit Order
- How to Read the Original Trading Chart
- Time horizon
- Candlesticks
- Wicks
- Volume chart
- Depth Chart
Let’s begin!
Crypto Trading 101: Exchanges, Trading Dashboards, Market KPIs, Order Book & History
What are some of the most popular and easy-to-access venues where to buy crypto?
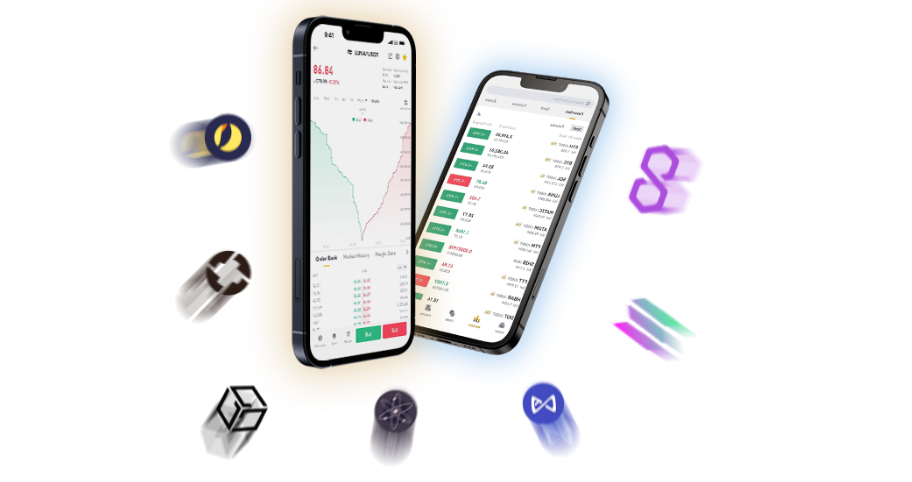
Crypto exchanges. Even those with little-to-no industry knowledge can easily set up an account and invest and trade digital currencies. Most exchanges, such as Binance, Coinbase, MEXC, etc., offer simple, mobile-friendly interfaces to enable trading on the go.
However, for those keen on day trading crypto, the pro versions of exchange platforms will offer sophisticated trading tools and features.
Binance, along with other exchanges, has two versions of trading platforms – Professional and Lite. The Pro interface offers tools such as charts, order books, buy/sell consoles, trading view, and others that help frequent traders navigate the market efficiently.
The Lite version offers a more straightforward interface with all the core functionality to buy an asset, excluding order books and charts.
Trading Dashboards
Below are a few examples of trading dashboards offered by some of the key crypto exchanges in the market.
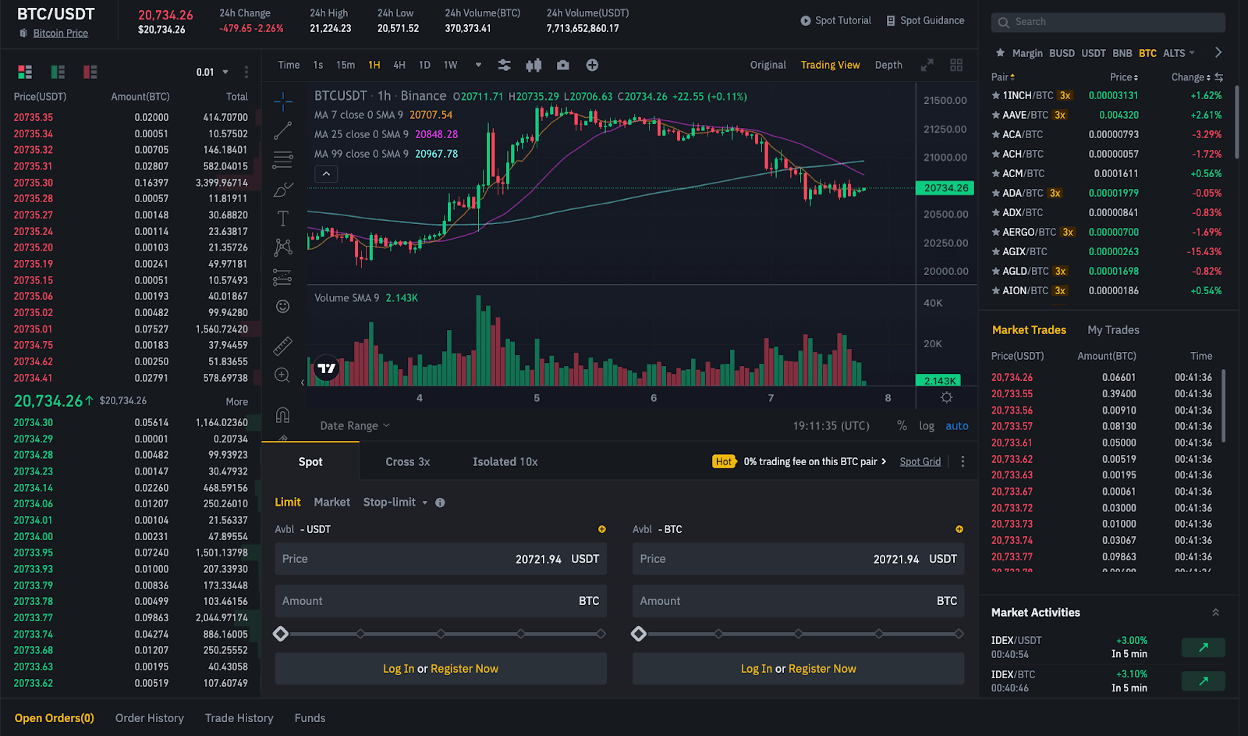
Binance Trading Dashboard
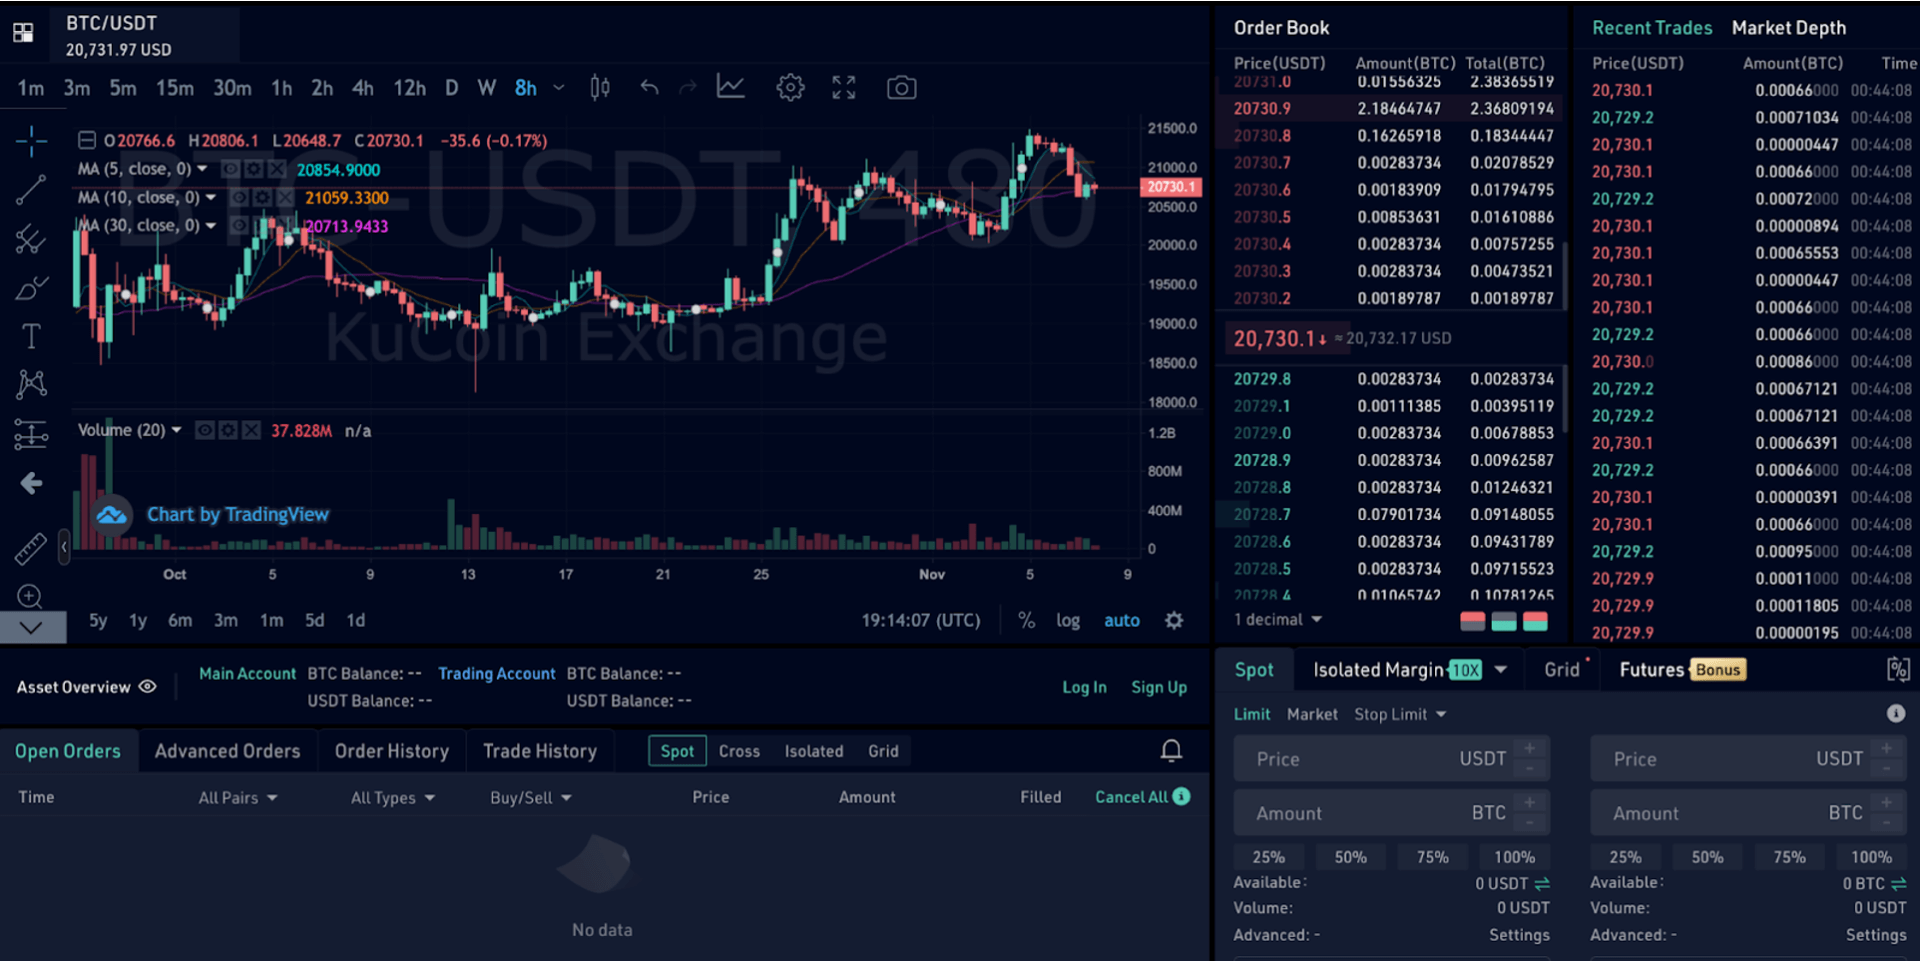
KuCoin Trading Dashboard
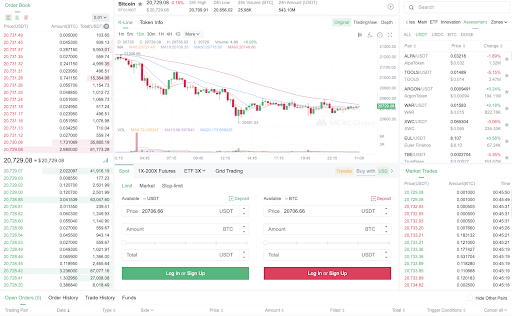
MEXC Trading Dashboard
As the above snapshots show, most trading platforms have similar features and offer a layout that helps traders make informed decisions.
However, each platform charges varying fees for crypto transactions via transaction fees or spreads, and that’s something to keep in mind while choosing one.
We’ll use the Binance dashboard as our reference point for this quick guide. We chose the classic setting of the platform layout for ease of understanding.
We will cover Market KPIs, Order Book, Favorites, Ways to Place an order (Market, Limit, Stop-Limit), How to Read the Trading Chart (time horizon, candlesticks, wicks, volume chart), and the Depth Chart.
Read on to learn more about them.

Market KPIs
The crypto trading pair is the first thing we see on the trading screen. Here, it is BTC (From) – EUR crypto asset market, which means we can swap from BTC (Bitcoin) to EUR (Euros).
In addition, you can see a few KPIs of this market which include:
- current real-time market price,
- price change denominated in dollars,
- percentage change vs. past day,
- the high and low values over the past day; and finally,
- the volume of tokens exchanged over the last 24 hours.
Order Book
Next, we’ll review the order book.
The top part in red shows all the open sell orders, and the bottom part, in green, lists all the open buy orders.
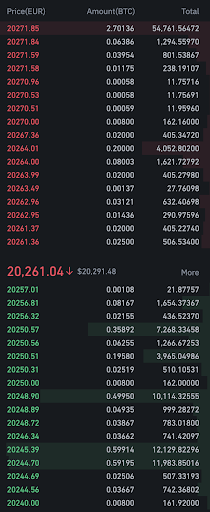
The lowest value order in red is the best available ask price, and the highest order at the bottom is the best bid price. The difference between these two is the bid-ask spread.
The lower the spread, the greater the likelihood of trades taking place. The bid-ask spread also gives insight about a crypto currency’s supply and demand dynamics.
The higher the spread (and lower liquidity), the less likely trades are to take place due to higher overall transaction costs for frequent traders.
Crypto market makers can come to the rescue and fix the situation by committing to quoting both bid and ask orders at predetermined spread levels, thus, making trading the particular asset more attractive and cost-efficient.
Trading Console
In the picture below, you can see the crypto trading console for initiating trades. There are three types of orders that crypto exchanges facilitate on the market – Market, Limit, and Stop-Limit Orders. Market Orders decrease liquidity from the exchange and are usually charged higher transaction fees compared to limit or stop-limit orders. Binance is one of the platforms with the lowest fees and, as seen in this case, offers free transactions in case of BTC/EUR pair. However, these fees change with the trading volume, which is something traders should keep in mind when placing their orders.
Market Order
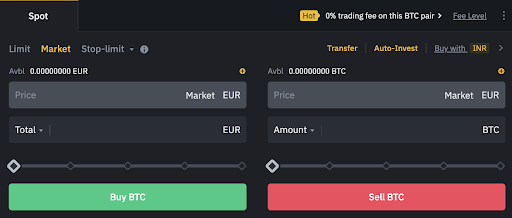
The Market Order window is for those who want to purchase BTC quickly or sell their BTC at the market price. You can quickly enter the number of euros you’d like to spend to buy or the amount of BTC you’d like to sell. Then, you can use the slider at the bottom to select a percentage of either of these assets from your wallet.
Limit Order
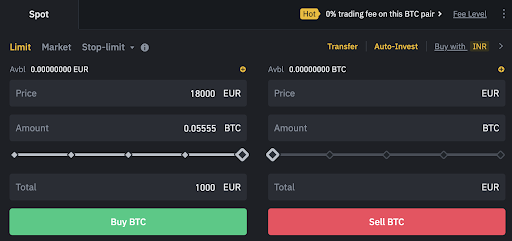
On the other hand, the limit order window helps you enter your bid or ask into the order book. This allows us to set the price for which we’re willing to purchase or sell the token.
For example, Bob may set up an automated order to buy 1,000 EUR worth of BTC when the price per bitcoin drops to 18,000 EUR.
Similarly, sellers can set a price at which they would like to sell and the quantity of bitcoin they want to sell. For example, Mary, may have purchased her bitcoin at 20,000 EUR and would like to sell it when BTC price reaches 22,500 EUR.
An important thing to note is that these orders get fulfilled only when the price reaches the set value, which could be at any point in the future – a second or a month, or any other time frame, depending on the market conditions. Furthermore, one may cancel a limit order before it gets fulfilled.
The order book is full of thousands of such real-time buy-and-sell orders by market players that get executed every millisecond, minute, or hour, depending on market conditions and liquidity.
Stop-limit Order
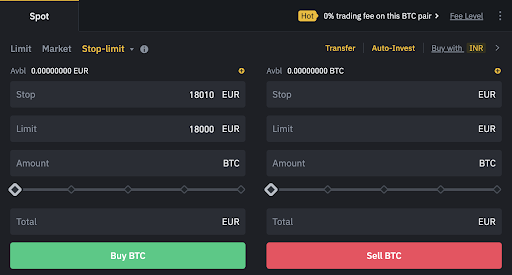
The final window in the trading console is the stop-limit window. This window takes it a step further by allowing to choose when to place bid or ask orders. It gives traders more control over when their orders would be filled. A stop-limit order is a feature traders can use to cut down their losses or make profits.
For example, let’s say Bob purchased one BTC for 17,000 EUR. He is willing to tolerate a price fall to 16,500 EUR, after which he’d like to liquidate the position.
Then, Bob would set the stop price to 16,550 EUR and the limit price to 16,500 EUR. As soon as the price reaches the stop point of 16,550 EUR, a sell order would be sent to the order book. As such, there will be more time for the order to get fulfilled by the time the price reaches 16500 EUR, minimizing any losses beyond his tolerance level.
The stop price can be set higher or lower than the limit price. However, Binance recommends that sell orders have a slightly higher stop price than the limit price to accommodate a safety gap between the time of order placement and fulfillment.
How to Read the Original Trading Chart
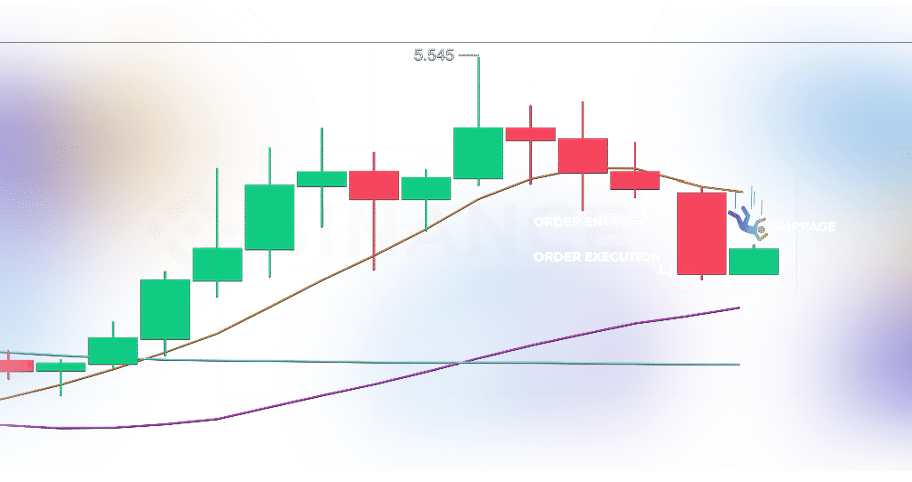
Candlestick charts are widely used visualizations that help traders understand price evolution over time. On trading dashboard it can be found under the “Original chart”. This section explains how to read the original chart and understand different parameters such as time horizon, studying candlesticks, and the volume bar graph at the bottom of the chart.
Time horizon
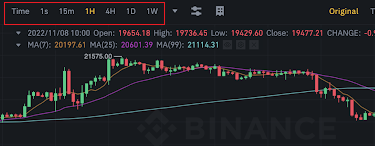
The charts section of the dashboard gives us a visual representation of the market status. The first is the famous candlestick chart that provides an instant view of market price changes, whether positive or negative, and to what extent. Unlike stock trading, crypto trading happens 24/7/365. Users can choose the overall timeframe of the graph between 1s (1 second), 15 m (15 minutes), 4H (4 hours), 1D (1 Day), or 1W (1 week).
Candlesticks
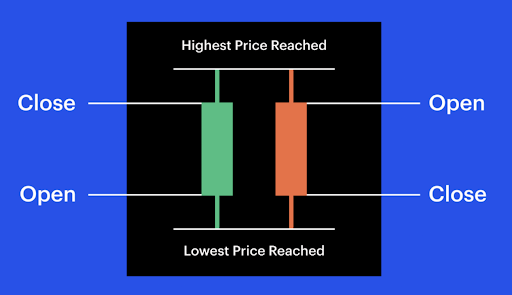
Source: Coinbase
The green candles show an increasing price, and the red candles indicate a decreasing price. The “wicks,” or the lines extending from either side of the bars, show the maximum and minimum price points in the selected time frame represented by the bar. The bar’s size depicts the price change in this period.
Wicks
The candle wicks offer a more detailed insight into the market movements.
![]()
For example, a long lower wick implies traders are interested in buying, which may increase the asset’s price.
![]()
A long upper wick implies a selling attitude amongst traders which means the price might be about to fall.
Almost zero-length wicks on either side imply a bullish period (price rise) in the case of a green candle, and a bearish period (price fall) in the case of a red candle.
Charts – Volume
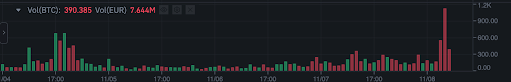
The Volume indicator at the bottom of the original chart depicts the volume of trades taking place per time period chosen. In the above figure, the time frame is set to 1 hour, meaning each bar represents the volume of trades taking place each hour.
People tend to mistake the bars’ color for buy and sell volumes. However, the bar’s color represents a price increase (green) or decrease (red) in that period, and the bar height represents the total traded volume.
The bar chart and the candlesticks are typically analyzed together. Together, the volume indicator and the candlesticks help traders read market trends for better-informed investment decisions.
Depth Chart
Last but not least, we discuss the depth chart offered on the Binance dashboard.
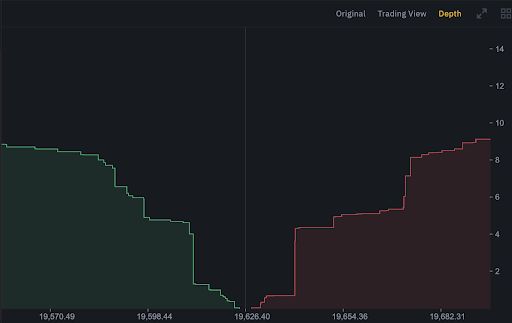
A depth chart is a visual tool to understand the supply and demand of crypto tokens at a given price. The bid line is the green line on the left side of the chart sloping negatively. A point on the bid line represents the cumulative value of the bids at a given price point. Similarly, the ask line represents the cumulative value of asks at a given price and is the red line on the right slide of the chart.
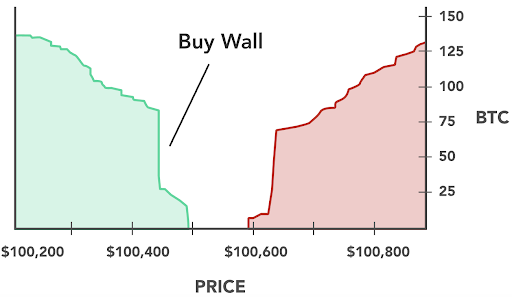
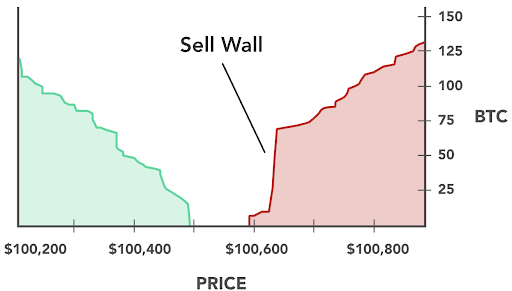
Source: River Financial
To read the depth chart we need to understand the meaning of buy and sell walls. A high amount of unrealized buy orders create a vertical wall effect on the graph and are called buy walls. Similarly, a high amount of unrealized sell orders create a sell wall. A large buy wall indicates that a great number of traders want to purchase the token at a given price indicating a bullish trend. Traders tend to buy the token for long-term profit or sell it instead to make short-term gains. A high sell wall implies a large volume of sell orders at a high price thereby reducing the possibility of a price increase. Traders then tend to sell in such a case.
Conclusion
Now that you have the basics, feel free to explore the trading platforms and play around with the functions for a better understanding. Most important of all, don’t forget to DYOR before actually trading crypto. We hope you enjoyed the article. Stay tuned for more coming soon!


Contact Us
We are always open to discussing new ideas. Do reach out if you are an exchange or a project looking for liquidity; an algorithmic trader or a software developer looking to improve the markets with us or just have a great idea you can’t wait to share with us!